
Introduction
E-commerce has evolved into a highly competitive, data-driven ecosystem where success depends on how effectively businesses understand customer behavior, optimize operations, and personalize user experiences. Every click, search, cart action, and purchase generates valuable data that can be used to improve conversion rates and operational efficiency.
At LognaTech, we design and implement modern e-commerce data and technology solutions that help online businesses unify their systems, improve decision-making, and scale effectively in fast-moving digital markets.
Key Challenges in E-commerce
Fragmented Data Across Platforms
E-commerce businesses typically operate across multiple systems such as:
- Online storefront platforms
- Payment gateways
- Inventory management systems
- Customer relationship tools
- Marketing and advertising platforms
This leads to disconnected data that is difficult to analyze holistically.
Limited Customer Visibility
Without unified analytics, businesses struggle to understand:
- Customer journeys across channels
- Product performance and demand patterns
- Cart abandonment behavior
- Repeat purchase trends
This limits the ability to personalize experiences and improve retention.
Inefficient Inventory and Order Management
Lack of integrated systems often results in:
- Stock inconsistencies
- Overstocking or understocking issues
- Delayed order fulfillment
- Poor demand forecasting
Our Approach to E-commerce Transformation
We build integrated data and technology ecosystems that connect all aspects of e-commerce operations into a single, intelligent platform.
Unified Data Integration
We consolidate data from multiple e-commerce systems into a centralized architecture, enabling a complete view of:
- Sales performance
- Customer behavior
- Product analytics
- Marketing effectiveness
Customer Data Processing
We structure and process raw customer and transactional data to enable:
- Behavioral segmentation
- Purchase pattern analysis
- Customer lifetime value tracking
- Personalized recommendation systems
Scalable Cloud Architecture
We design cloud-based systems that support:
- High transaction volumes
- Real-time data processing
- Flexible scalability during peak demand periods
- Secure handling of customer and payment data
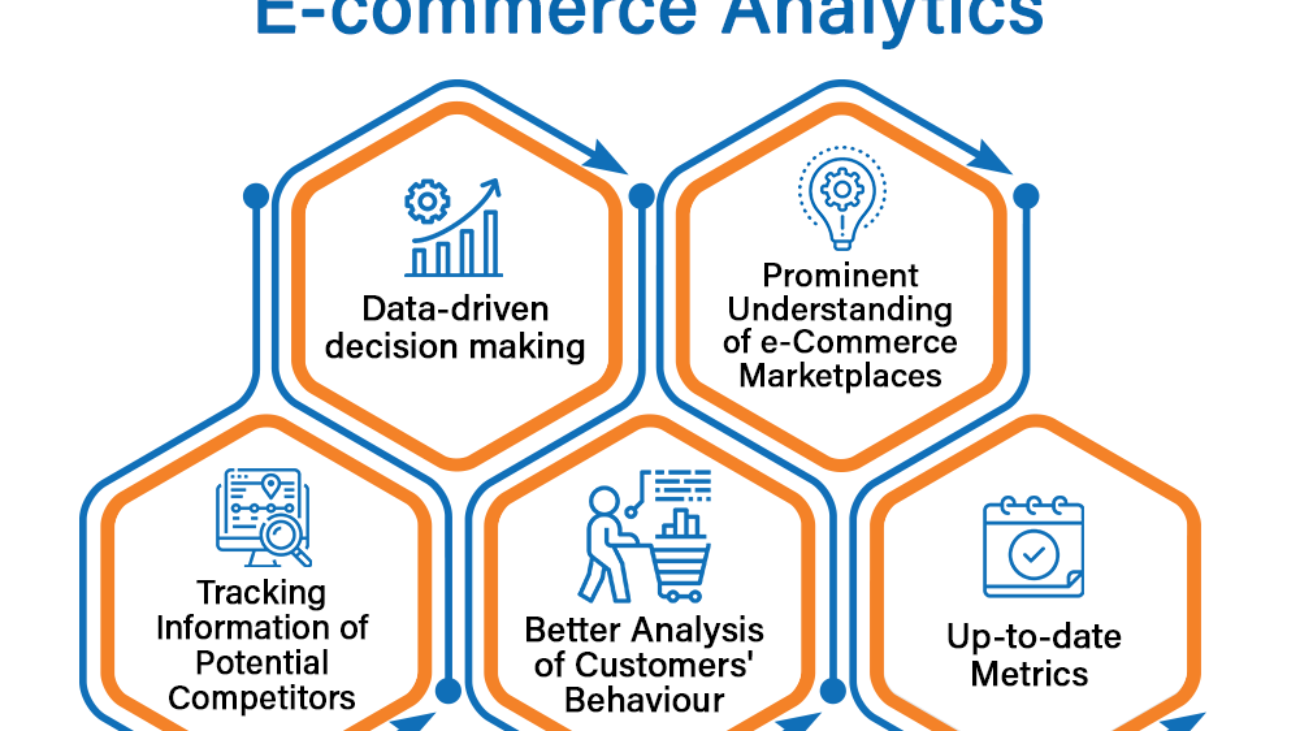
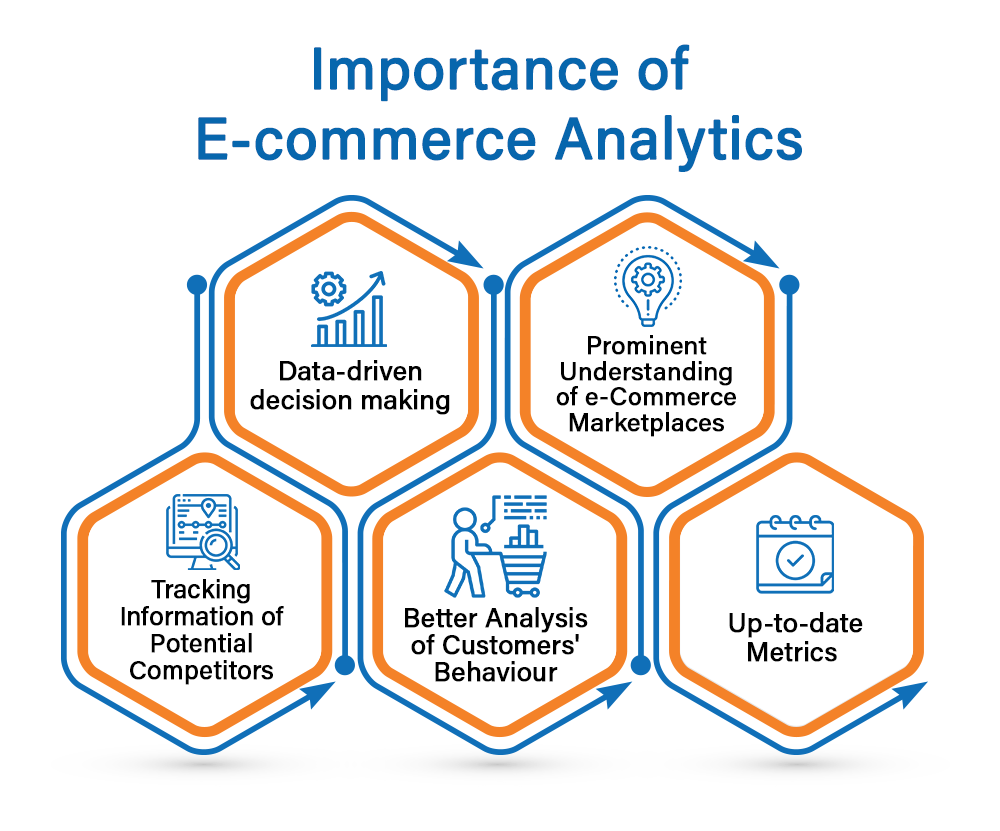
Core Capabilities Delivered
1. Customer Behavior Analytics
We enable businesses to understand how customers interact with their platforms, including:
- Browsing patterns
- Purchase journeys
- Drop-off points
- Engagement trends
2. Sales & Product Performance Analytics
We provide visibility into:
- Best-selling products
- Revenue trends
- Seasonal demand fluctuations
- Pricing effectiveness
3. Marketing Analytics
We help businesses evaluate the performance of marketing channels by analyzing:
- Campaign ROI
- Customer acquisition cost
- Conversion rates
- Channel attribution
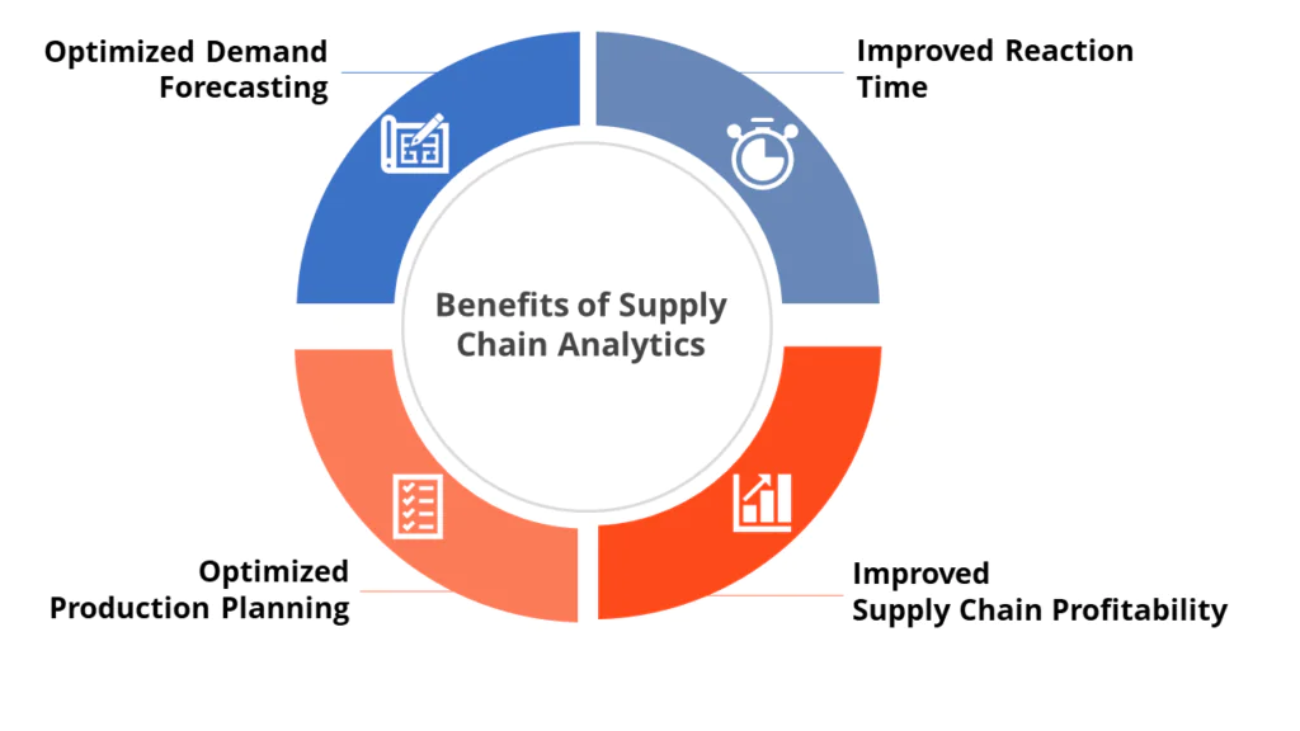
4. Inventory & Demand Intelligence
We enable smarter inventory decisions through:
- Demand forecasting models
- Stock optimization insights
- Supply chain alignment
- Order fulfillment tracking
Business Impact
Organizations adopting modern e-commerce analytics solutions experience:
- Increased conversion rates through better customer insights
- Improved personalization and user experience
- Reduced cart abandonment
- Optimized inventory and supply chain performance
- Stronger marketing ROI through data-driven decisions
Modern e-commerce success is built on data intelligence, operational efficiency, and customer-centric design. Businesses that unify their data and leverage advanced analytics gain a significant competitive advantage in highly dynamic markets.
At LognaTech, we help e-commerce companies build scalable, intelligent systems that transform raw data into meaningful insights, enabling growth, efficiency, and long-term success.